Monitor Guardian Node
Congratulations on successfully setting up your Guardian node on the MOI network! Now that your node is up and running, you can monitor its activity and health through the Guardian Node Activity Page in Voyage. Follow the steps below to access and interpret the information available on this page.
Accessing the Guardian Node Activity Page
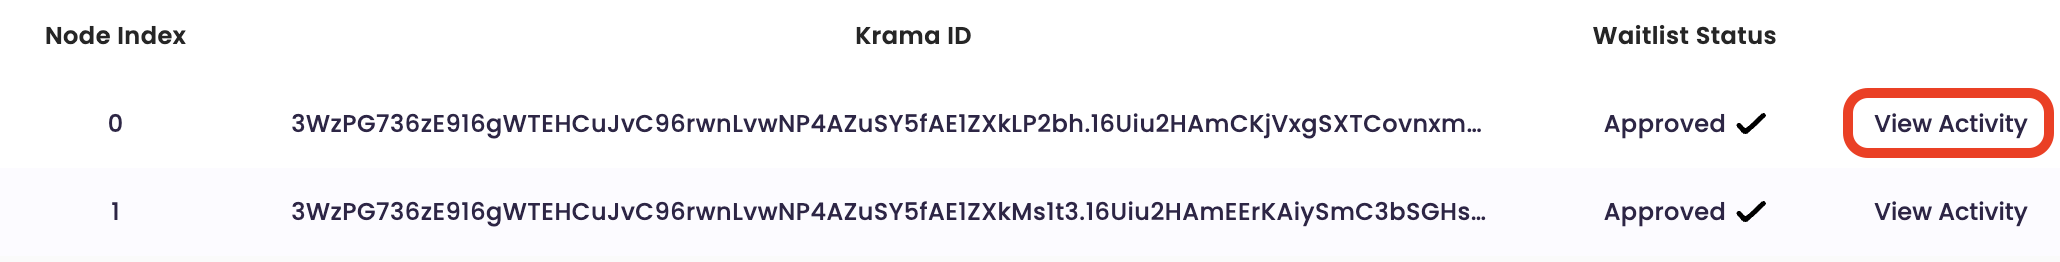
- After setting up your Guardian Node by following the steps in the Setup Guardian section, you can check your node's health by visiting the Guardians section in Voyage.
- On the right side of your Guardian Krama ID's waitlist status, you will find the button labeled
View Activity. Clicking this button will direct you to the Node Activity page.
Guardian Node Activity Page Overview
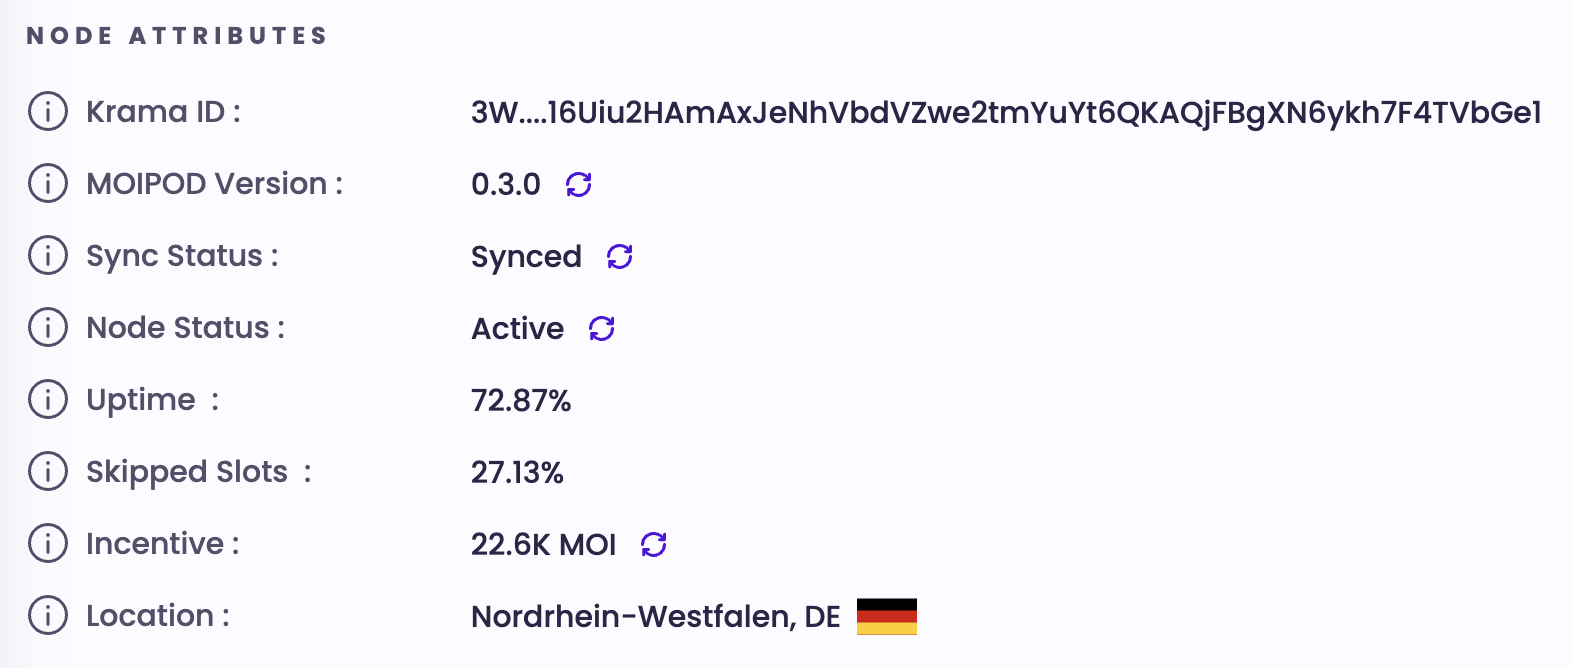
On the Guardian Node Activity Page, you will find detailed information about your Guardian Node. Below is a breakdown of the key metrics available:
- Krama ID: Unique identifier for your Guardian Node.
- MOIPOD Version: Indicates the version of the MOI network that your node is currently running.
- Sync Status: Provides information about whether your node is synchronized with the network.
- Node Status: Indicates whether the machine hosting your node is reachable by our monitoring system.
- Uptime: Displays the total uptime of your node since it was registered on the network.
- Skipped Slots: Shows the total downtime of your node since registration.
- Incentive: Provides information about the incentives earned by your Guardian Node.
- Location: Indicates the geographical location of where your node exists.
Important Checks
To ensure that your Guardian Node is operating properly, pay attention to the following:
- MOIPOD Version: Ensure that your node is running the latest version of the MOI network.
- Sync Status: Confirm that your node is synchronized with the network.
- Node Status: Verify that the machine hosting your node is reachable.
Heartbeat and Skipped Slots Graphs
Heartbeat Graph
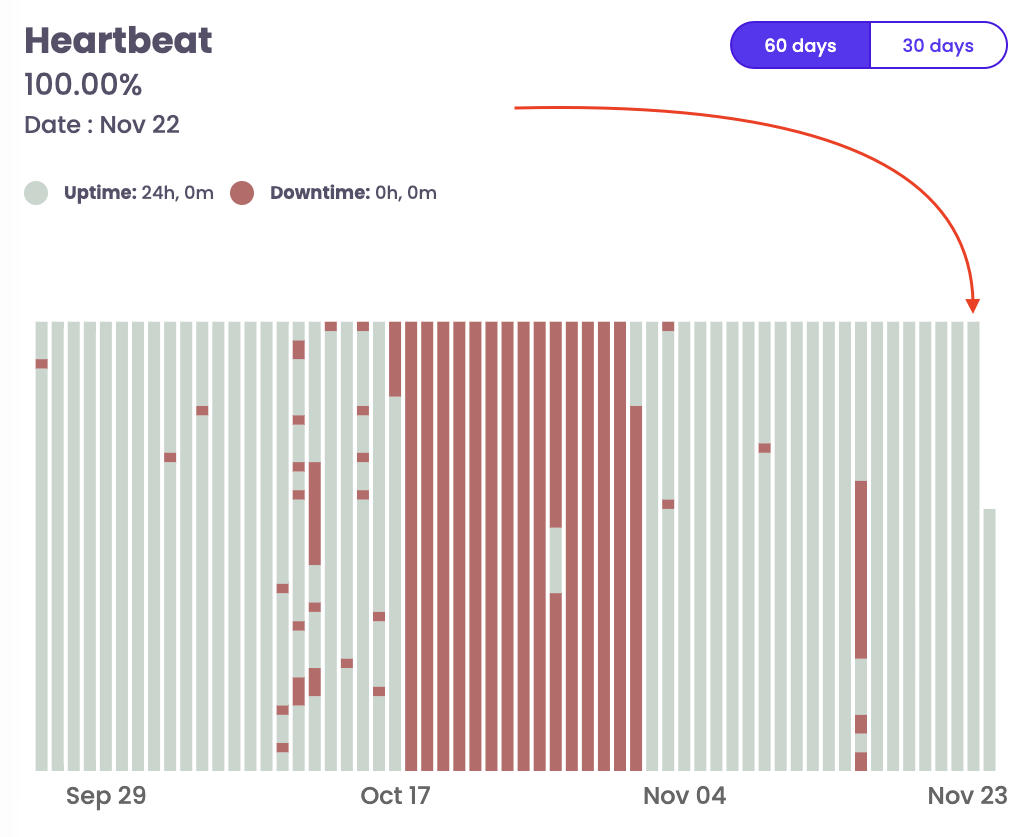
The Heartbeat graph provides detailed information about your node's activity on a daily basis. By hovering over the bar of a specific day, you can obtain the following information:
- Uptime Percentage: The percentage of time your node has been operational on that day.
- Uptime Hours: The total hours your node has been operational on that day.
- Downtime Hours: The total hours your node has been offline or inactive on that day.
Skipped Slots Graph
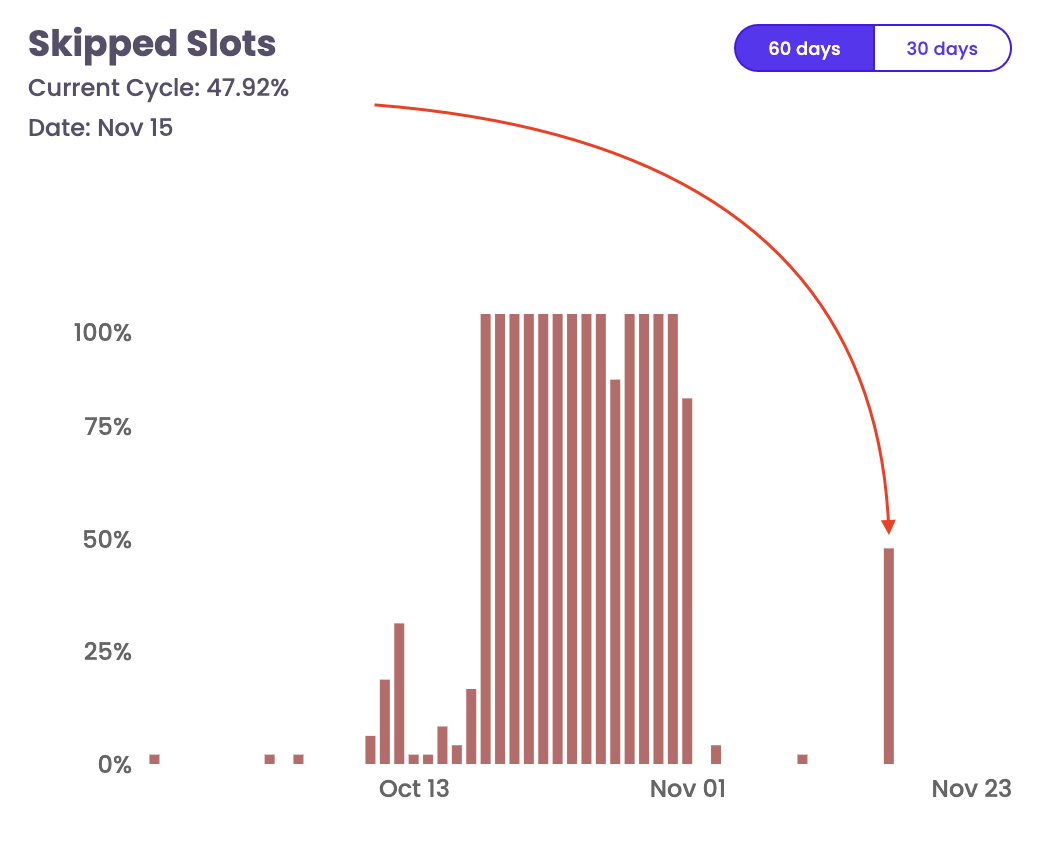
The Skipped Slots graph illustrates the downtime percentage of your node for each day. By hovering over the bar of a specific day, you can view the downtime percentage for that day.
Monitoring these metrics and graphs will help you ensure the optimal performance and health of your Guardian Node.